
Data Visualization
2 reportsData Visualization is a research method used to collect, compare, or analyze evidence under explicit design assumptions. Valid use requires validation procedure, measurement principle, and data collection, with transparent assumptions and checks against bias or model misspecification.
Current work on Data Visualization is assessed through bias control, interpretation of uncertainty, and study design. For study design, the primary record comes from sensitivity analysis, with replication or validation providing a separate test; the main constraint is that violated assumptions or selective reporting can change the conclusion.
Current work on Data Visualization is assessed through bias control, interpretation of uncertainty, and study design. For study design, the primary record comes from sensitivity analysis, with replication or validation providing a separate test; the main constraint is that violated assumptions or selective reporting can change the conclusion.
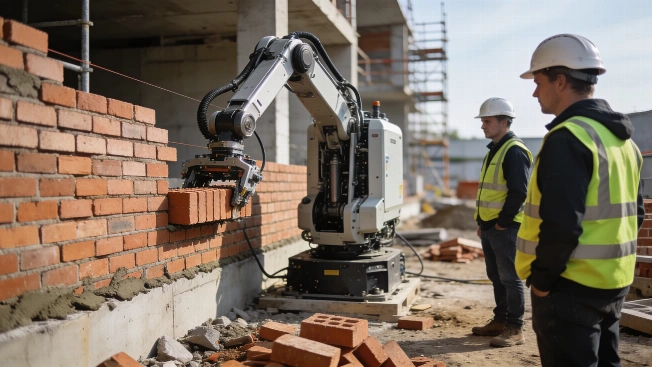
Autonomous Bricklaying Robots Face Real Construction Site Obstacles
Monumental has begun deploying autonomous robots to build brick walls on commercial construction sites, aiming to address labor shortages and rising costs. The company's approach highlights the technical and operational hurdles of moving robotics from controlled labs to unpredictable real-world environments

NASA Schedules Hyperwall Science Talks for IGARSS 2026 in Vienna
NASA will present a series of Hyperwall science talks at IGARSS 2026, featuring mission updates and instrument demonstrations from Earth and planetary science experts in the exhibit hall