
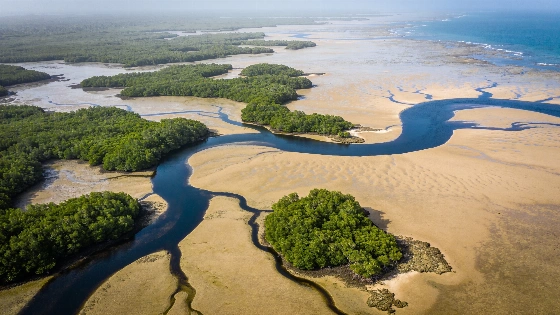
A NASA satellite image captures how twice-daily tides redraw Guinea-Bissau's Bijagós Archipelago, exposing broad mudflats and sandflats before seawater returns through its mangrove channels
A satellite view of Guinea-Bissau's Bijagós Archipelago shows a landscape that changes dramatically over the course of a single day. Twice daily, ocean water moves through the sandy channels, mudflats, and mangrove forests surrounding the archipelago's 88 islands and islets.
The image was acquired on Nov. 28, 2025, when a falling tide had exposed wide areas of intertidal sediment. From above, the newly revealed flats make the islands appear to spread outward, while dark channels retain water and trace the routes followed by the incoming and outgoing tides.
A landscape in motion
The apparent expansion is not the growth of land in the geological sense. It is a temporary change in which parts of the seafloor are visible. As the tide falls, mudflats and sandflats emerge around the islands; as the tide rises again, those surfaces disappear beneath shallow seawater.
This distinction matters when interpreting satellite imagery. A single image records the condition of the coast at one point in time, rather than showing a permanent boundary between land and sea. In a tidal environment, the visible outline of an island depends strongly on the water level when the observation was made.
The channels are especially clear in the image because they remain filled with darker water while surrounding sediment is exposed. Their branching patterns show how tidal flow is distributed across the archipelago, with mangrove-covered areas lining parts of the channels and shoreline.
What the image records
The scene is an overhead observation of surface conditions, not a direct measurement of tidal height or flow speed. The colors and contrasts distinguish water, exposed sediment, and vegetated islands in the processed image, allowing the geometry of the coastal system to be seen at regional scale.
That kind of view is useful because the Bijagós Archipelago is made up of many low-lying islands separated by shallow waterways. Ground observations can document individual beaches, channels, or mangrove stands, but a satellite perspective places those features in one connected map of the intertidal zone.
Remote sensing also has limits. The image does not by itself establish how quickly each channel carries water, how much sediment moves during a tide, or how the coastline changes over months and years. Those questions require repeated observations, measurements in the field, or hydrodynamic and sediment-transport models.
Remote views, different signals
Satellite imagery records reflected or emitted radiation rather than producing a conventional photograph of the landscape as a person would see it. Processing can assign colors or contrast to features so that water, sediment, and vegetation are easier to separate, while the underlying observation remains tied to the date and conditions of collection.
The method differs from the infrared observations used by NASA's James Webb Space Telescope to map dusty structures in a nearby galaxy's obscuring dust lanes, but both examples rely on interpreting patterns in recorded radiation. In each case, the image is evidence about a physical scene; it is not the scene itself and must be read with the instrument and observing conditions in mind.
For the Bijagós Archipelago, the clearest conclusion is straightforward: the tide repeatedly changes how much land is exposed. The image does not indicate that the islands are permanently enlarging or shrinking, but it does show why their visible footprint can alter sharply between low and high tide.
The Bijagós Archipelago is a tidal system in which the coastline is partly defined by the position of the water at a given moment. At low tide, intertidal flats are exposed; at high tide, they are covered again. This periodic flooding and exposure is why satellite images taken at different tidal stages can make the same coast appear substantially different.
Text credit: Adam Voiland. Image credit: NASA/Lauren Dauphin, USGS.